Log files
TigerGraph Database captures key information on activities occurring across its different components through log functions that output to log files. These log files are not only helpful in troubleshooting but also serve as an auditory resource. This document gives a high-level overview of TigerGraph’s logging structure and lists some common information one might need to monitor their database services and where to obtain them in the logs.
Available Log Files
TigerGraph generates a variety of log files for its different components. Understanding what logs are available and what they contain is the first step in effective troubleshooting and system monitoring.
Log File Locations
Logs in TigerGraph are stored in the log root directory, which is configured at install time. You can find this location by running:
gadmin config get System.LogRootWithin this directory, you will find subdirectories for each TigerGraph component (admin, gpe, gsql, gui, kafka, nginx, zk, etc.).
$ ls /home/tigergraph/tigergraph/log
admin dict executor gpe gsql informant kafkaconn nginx zk
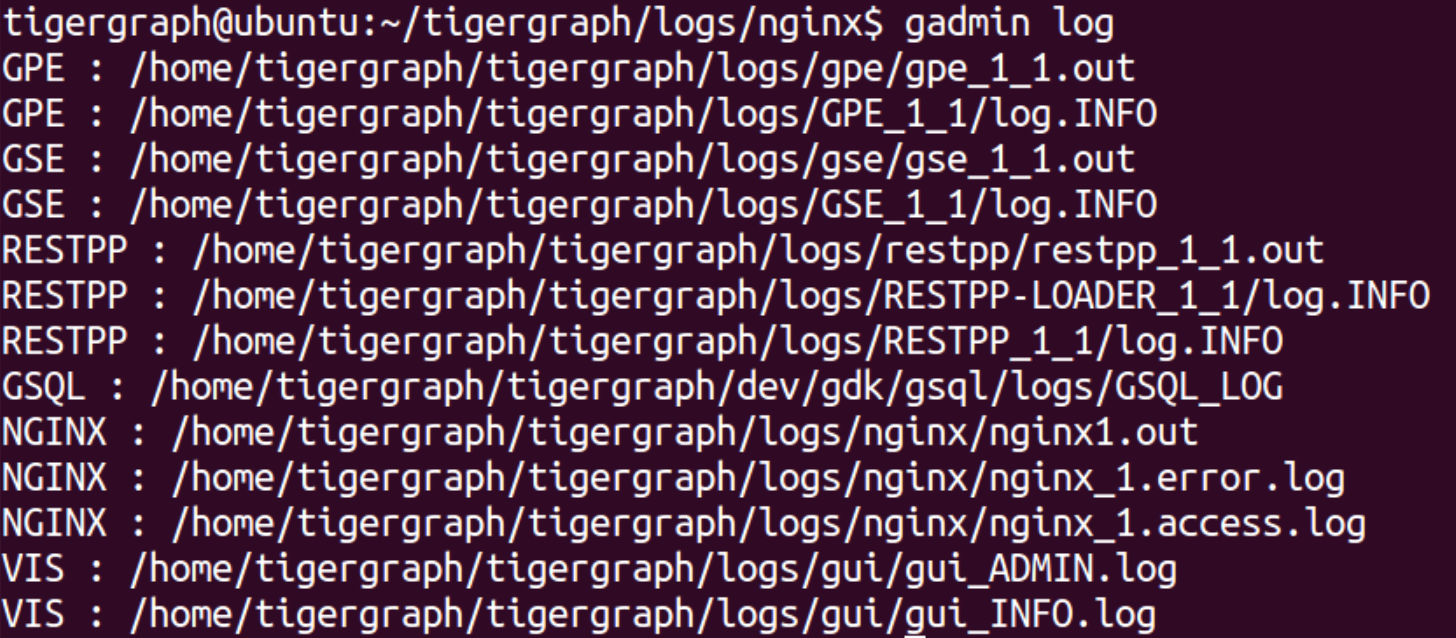
controller etcd fileLoader gse gui kafka kafkastrm-ll restppUse the gadmin log command to list log files:
$ gadmin log
ADMIN  : /home/tigergraph/tigergraph/log/admin/ADMIN#1.out
ADMIN  : /home/tigergraph/tigergraph/log/admin/ADMIN.INFO
CTRL   : /home/tigergraph/tigergraph/log/controller/CTRL#1.log
CTRL   : /home/tigergraph/tigergraph/log/controller/CTRL#1.out
...
ZK     : /home/tigergraph/tigergraph/log/zk/ZK#1.out
ZK     : /home/tigergraph/tigergraph/log/zk/zookeeper.log
Use the command gadmin log <service name> to get the logs for a specific service:
$ gadmin log gpe
GPE    : /home/tigergraph/tigergraph/log/gpe/GPE_1#1.out
GPE    : /home/tigergraph/tigergraph/log/gpe/log.INFO
Third-Party components like Zookeeper and Kafka have logs that are not listed by gadmin log. You can find them at:
zookeeper : ~/tigergraph/zk/zookeeper.out.*
kafka     : ~/tigergraph/kafka/kafka.out
In a TigerGraph cluster, each node maintains logs only for the activities that occur on that node. Logs are not automatically replicated across nodes.
For example, the GSQL logs on the m1 node reflect only the operations performed on m1.
To determine which node is currently the GSQL leader, check the most recent log.INFO file on m1.
For example, the logs below recorded a GSQL leader switch from m2 to m1:
I@20210709 13:56:52.214  (GsqlHAHandler.java:231) GSQL leader switches from 'm2' to 'm1' ...
E@20210709 13:56:52.215  (GsqlHAHandler.java:246) GSQL HA leader switches to 'm1', abort and clear all sessions now.
If you want to lower the chance of leader switch by increasing timeout, please use 'gadmin config' to increase 'Controller.LeaderElectionHeartBeatMaxMiss' and/or 'Controller.LeaderElectionHeartBeatIntervalMS'.
I@20210709 13:56:52.219  (SessionManager.java:197) Abort and clear all sessions...
I@20210709 13:56:52.220  (SessionManager.java:204) All sessions aborted.
I@20210709 13:56:52.224  (GsqlHAHandler.java:283) switched to new leader m1
TigerGraph Component Log Files
-
.outfiles capture standard output (stdout) and log runtime information, including error stack traces when services crash or unexpected errors occur. These logs are especially useful for errors that aren’t logged by the service’s internal logging mechanism. -
.ERRORfiles are used to log errors captured by the system, typically from exceptions caught in try-catch blocks. If an error occurs before the logging system initializes or is uncaught, it is logged in the.outfile instead. -
.INFOfiles log regular operational information about the system’s normal functioning.
To diagnose an issue for a given component, check the .out log file for that component.
|
The GUI component writes all log levels to a single log file and does not generate separate
Replace |
Symbolic Links
In directories with frequently checked logs, such as restpp, gsql, and admin, symbolic links make it easier to access the latest log file.
These links are automatically updated to point to the newest log.
For example, log.INFO is a symbolic link that points to the current .INFO log file. To see what a symbolic link points to, use ls -ll followed by the symbolic link name:
ls -ll log.INFO
log.INFO -> log.INFO.2024-07-01-10-00-00
Here, log.INFO is a symbolic link pointing to the current .INFO log file.
Third-Party Component Log Files
TigerGraph uses several open-source components (such as Kafka, Nginx, ZooKeeper, Kafkaconn, Kafkastream) that maintain their own log conventions.
-
NGINX Logs: The NGINX log files (e.g.,
nginx.out,nginx.error.log,nginx.access.log) are generated directly by the NGINX web server itself and are not internal TigerGraph component logs. -
Kafka Logs: Kafka logs include
controller.log,kafka.log,kafka-request.log,state-change.log, andserver.log. -
ZooKeeper Logs: ZooKeeper logs are typically found as
zookeeper.out.*in the ZooKeeper directory.
TigerGraph log structure
|
Log formats may differ between |
-
log.INFO: Contains regular output and errors. -
log.ERROR: Contains errors only. -
<component_name>.out: Contains all output from the component process. Current.outlogs have the form<service name>.out. Historical logs have the form<service name>-old-YYYY-MM-DDTHH-MM-SS.fff.out -
log.WARNINGorlog.DEBUG-
log.WARNINGcontains warnings and all error-level messages. -
log.DEBUGcontains debug-level messages (not created by default).
-
-
log.FATAL: Contains outputs for any fatal level events
|
All services do not create a |
Monitor request history
All requests made to TigerGraph’s REST endpoints are recorded by the RESTPP logs and Nginx logs. Information available in the logs includes:
-
Timestamp of the request
-
API request parameters
-
Request Status
-
User information (when RESTPP authentication is turned on)
RESTPP is responsible for many tasks in the TigerGraph internal architecture and records many internal API calls, which can be hard to distinguish from manual requests. When RESTPP authentication is on, the RESTPP log will record the user information and mark a call if it is made by an internal API. Therefore, you can use the command below to filter for manual requests:
# In the restpp log directory
$ grep -i "requestinfo" log.INFO | grep -v "__INTERNAL_API__"

# All requests exluding the ones made by internal API
I0315 21:11:59.666318 14535 handler.cpp:351] RequestInfo|,1.RESTPP_1_1.1615842719666.N,NNN,0,0,0|user:tigergraph|api:v2|function:NoSchema|graph_name:social|libudf:
I0315 21:41:36.462616 14541 handler.cpp:351] RequestInfo|,196622.RESTPP_1_1.1615844496462.N,NNN,0,0,0|user:tigergraph|api:v2|function:NoSchema|graph_name:social|libudf:
RequestInfo contains the ID of the request, which you can use to look up more information on the request :
.png)
Here is an example of using a request ID to look up a request in the restpp log:
$ grep "1615842719666" log.INFO
# Returns all information about the specific request
# RawRequest log is captured at the entry point of a query
I0315 21:11:59.666026 14535 handler.cpp:285] RawRequest|,1.RESTPP_1_1.1615842719666.N,NNN,0,0,0|GET|/echo?parameter1=parameter_value|async = 0|payload_data.size() = 0|api = v2
# RequestInfo log is captured after the request has been parsed,
# and contains information such as username and the function or UDF to run
I0315 21:11:59.666318 14535 handler.cpp:351] RequestInfo|,1.RESTPP_1_1.1615842719666.N,NNN,0,0,0|user:tigergraph|api:v2|function:NoSchema|graph_name:social|libudf:
# ReturnResult is captured when the request has been processed
I0315 21:11:59.666509 14535 requestrecord.cpp:325] ReturnResult|0|0ms|RESTPP|1.RESTPP_1_1.1615842719666.N|user:tigergraph|/echo|graph_id=1&graph_name=social¶meter1=parameter_value|39Monitor user management tasks
User management activities, such as logins, role and privilege changes are recorded in the GSQL logs in the folder gsql.
To view recent activities, use the symlink log.INFO. There is a lot of information in the logs - to filter for information that you need, you can use Linux commands such as grep and tail For example, to view recent changes in roles, you can run the following command in the gsql log directory:
$ grep -i "role" log.INFO

# Returns all lines containing the word "role"
#                        username     source IP
I@20210312 22:41:16.167 tigergraph|127.0.0.1:45854|00000000077 (BaseHandler.java:133) Received|POST|/gsql/roles?action=grant&role=globaldesigner&name=lennessy|0
I@20210312 22:41:16.863 tigergraph|127.0.0.1:45854|00000000077 (BaseHandler.java:167) Successful|POST|/gsql/roles?action=grant&role=globaldesigner&name=lennessy|application/json; charset=UTF-8|696ms
To view login activities, search log.INFO for "login" instead.
$ grep -i "login" log.INFO

# Returns all lines containing the world "login"
I@20210315 21:08:42.047 tigergraph|127.0.0.1:53960|00000000001 (BaseHandler.java:133) Received|POST|/gsql/login|28
I@20210315 21:08:42.061 tigergraph|127.0.0.1:53960|00000000001 (LoginHandler.java:52) The gsql client is started on the server, and the working directory
is /home/tigergraph/tigergraph/log/restpp
I@20210315 21:08:42.072 tigergraph|127.0.0.1:53960|00000000001 (LoginHandler.java:80) Successful|Login|tigergraph
I@20210315 21:08:42.080 tigergraph|127.0.0.1:53960|00000000001 (BaseHandler.java:167) Successful|POST|/gsql/login|application/json; charset=UTF-8|35ms